Abstract
-
Objectives
- The aim of this study was to develop a filtering algorithm for raw nystagmus images and a diagnostic assistive algorithm using a principal component analysis (PCA) to distinguish the different types of benign paroxysmal positional vertigo (BPPV).
-
Methods
- Fifteen video clips of clinical data with typical nystagmus patterns of BPPV (13 cases) and with normal nystamgmus (two cases) were preprocessed when applied the thresholding, morphology operation, residual noise filtering, and center point extraction stages. We analyzed multiple data clusters in a single frame via a PCA; in addition, we statistically analyzed the horizontal and vertical components of the main vector among the multiple data clusters in the canalolithiasis of the lateral semicircular canal (LSCC) and the posterior semicircular canal (PSCC).
-
Results
- We obtained a clear imaginary pupil and data on the fast phases and slow phases after preprocessing the images. For a normal patient, a round shape of clustered dots was observed. Patients with LSCC showed an elongated horizontal shape, whereas patients with PSCC showed an oval shape at the (x, y) coordinates. The scalar values (mm) of the horizontal component of the main vector when performing a PCA between the LSCC- and PSCC-BPPV were substantially different (102.08±20.11 vs. 32.36±12.52 mm, respectively; p=0.0012). Additionally, the salar ratio of horizontal to vertical components in LSCC and PSCC exhibited a significant difference (16.11±10.74 mm vs. 2.61±1.07 mm, respectively; p=0.0023).
-
Conclusions
- The data of a white simulated imaginary pupil without any background noise can be a separate monitoring option, which can aid clinicians in determining the types of BPPV exhibited. Therefore, this analysis algorithm will provide assistive information for diagnosis of BPPV to clinicians.
-
Keywords: Nystagmus; Videonystagmography; Benign paroxysmal positional vertigo; Vestibulo-ocular reflex; Principal component analysis
-
중심단어: 안진, 비디오 안진기, 양성돌발체위현기증, 전정안 반사, 주성분 분석
INTRODUCTION
Videonystagmography (VNG) is a system for recording, analyzing, and reporting eye movements using video-imaging technology that employs video goggles with infrared cameras [1]. VNG helps diagnose unilateral/bilateral loss of the vestibular function, detect central lesions that are missed during a routine physical exam, and confirm the types of benign paroxysmal positional vertigo (BPPV). BPPV is a major cause of vertigo and occurs in approximately 17% to 42% healthy adults, with 5.6 million clinic visits reported in the United States annually [2]. A particle repositioning maneuver with an accurate diagnosis and pathogenesis readily cures BPPV patients under VNG examination in a clinic [3]. Horizontal and torsional eye movements can occur according to the stimulation of the head rotation through the vestibulo-ocular reflex (VOR). Furthermore, an electronystagmogram (ENG) and VNG can detect the VOR in the diagnosis and treatment of BPPV. ENG applies the corneal-retinal potential variation principle during eye movements to record limited eye-movement information, whereas VNG is a computerized system allowing a three-dimensional (3D) analysis of eye movements (horizontal, vertical, and torsional) [4]. VNG is widely used because it can be easily and intuitively inspected in an outpatient; however, varying results are possible depending on the interpretation, and significant attention from doctors is required during examination. Although a VNG examination of the nystagmus is critical to the diagnosis of BPPV, inappropriate interventions in the VNG of BPPV patients by unskilled general physicians can delay immediate treatment. Therefore, a diagnostic support system for the detection and analysis of eye movements can be employed to facilitate an accurate diagnosis of BPPV when experienced specialists cannot assist. Appropriate treatment is possible even in developing countries by using a program applying the proposed algorithm.
Lim et al. [5] introduced a diagnostic decision support system using a deep-learning model to 91,778 video clips recording the positional nystagmus from 3,467 BPPV patients. A high sensitivity and specificity were observed after the classification of nystagmus and the localization of the affected canal in patients with BPPV. Ben Slama et al. [6] studied the diagnosis of vestibular neuritis and developed a diagnostic system based on a nystagmus parameter estimation using a pupil detection algorithm; subsequently, they applied a principal component analysis (PCA) to the images.
We developed a pattern-recognition algorithm for nystagmus data to develop a filtering algorithm for raw nystagmus images and a diagnostic assistive algorithm using PCA to distinguish the different types of BPPV (Fig. 1). Thus, the analysis algorithm will provide supportive information for the diagnosis of BPPV to clinicians.
MATERIALS AND METHODS
1. Dataset
This study was approved by the Institutional Ethics Committee at Yonsei University Wonju College of Medicine in Wonju, Korea (No. CR319082), and all subjects provided written consent.
The 15 video clips used as clinical data had typical nystagmus patterns of BPPV and were provided by Yonsei University Wonju College of Medicine. We obtained two normal cases, seven cases of canalolithiasis in the lateral semicircular canal (LSCC), and six cases of canalolithiasis in the posterior semicircular canal (PSCC). All clinical data were recorded using equipment with a VNG unit, an analysis program, and near infrared conventional charge-coupled device (NIR-CCD) camera goggles supporting 30 frames/sec with a 640×480-pixel resolution (Easy-Eyes, SLMED, Seoul, Korea). A specialized otologist participated in all processes to select the clinical data for the experiments. However, on a single frame, the selected video clips included all of the eyes images through a VNG unit and nystagmus inspection scenes that have an inspector and a patient. To obtain the region of interest (only eyes images), the clips were edited from original video clips again. These edited clips were classified according to the nystagmus type for systematic experiments.
2. Design of Nystagmus Phantom
Phantom models were designed to describe the typical nystagmus patterns caused by the LSCC- and PSCC-BPPV using a 3D design tool (3ds Max, Autodesk, San Rafael, CA, USA), while containing the pupils, irises, and a light source (Fig. 2). The eyelids and eyelashes were not implemented, because the models are used to assess the basic center tracking performance of the developed analysis algorithm. Additionally, each model includes 300 frames for implementing a geotropic left-beat (fast phase of BPPV). Each frame was processed using the developed image processing algorithms for tracking the pupil centers, which became the base of the data to be displayed in the target domain and a window for the PCA. If five left or right beats have to be expressed in a phantom model, five frames with a gap exceeding 15 pixels when compared with a previous frame are assigned to the phantom model. Thus, the five frames generate fast phases, and the remaining (295 frames) are recognized as the slow phases when the pupil centers from this phantom model are classified through the developed image processing algorithms. Accordingly, three phantom models that ideally have 12, 24, and 36 geotropic left-directional fast beats during 30 seconds were designed for this study. The frame rate of the phantom models is 30 frames/sec for each model.
3. Preprocessing of Images in Videonystagmography
The edited video clips were processed for use as input data in the developed analysis algorithms. The processing included thresholding, morphology operation, and residual noise filtering stages (Fig. 3).
In digital image processing, a well-known technique for image segmentation is thresholding, which can also be utilized for noise removal in documents or graphic images. Various thresholding techniques, e.g., thresholding using Otsu’s method, recursive thresholding, and local adaptive thresholding have been proposed [7-14]. However, the technique selected in this study is a global thresholding with a single threshold value. Specifically, this means that the thresholding technique, which has complex calculation processes, is not needed because the clinical data are acquired using goggles with an NIR-CCD camera in the dark, and the dark condition suppress noises occurring from environmental factors. The technique allows users to adjust a threshold value, which becomes the criterion for converting the given image pixels into zeros or the maximum value. The relative values used in the thresholding compared to the original image were 150 (we set the black as the value of zero and the threshold of original image as 255. For grayscale images, the pixel value is typically an 8-bit data value from 0 to 255.) for the phantom experiments and 100 for the experiments using clinical data, which were experimentally found. In addition, an algorithm reversing the results of the thresholding was added for effective monitoring of processed patient data. Consequently, the pupils are shown with white pixels, and the remaining parts are displayed with black.
A frequently used technique employed with thresholding during digital image processing is mathematical morphology, which is defined as a theory of image transformation and functionals derived from set theory and integral geometry and typically used to eliminate noises, including erosion and dilation. Erosion is a morphological transformation that calculates the vector subtraction of a given image having set elements and is used for eliminating noises and small objects. Dilation is a morphological transformation that calculates the vector addition of a given image having set elements, which can be applied for smoothing effect or hole-filling in image analysis. In practice, these operations, i.e., erosion and dilation, are generally utilized in pairs; particularly, erosion followed by dilation is called ‘opening,’ and conversely, ‘closing’ is when dilation is followed by erosion. We found that some noises significantly occurring from eyelids and eyelashes degraded the performance of our algorithm, thereby leading to a misdiagnosis by providing distorted data. Therefore, to overcome this, the opening was applied to our preprocessing algorithm for separating the pupils, eyelids, and eyelashes of the patients, owing to the effectiveness of the opening in eliminating small objects, breaking narrow isthmuses, and sharping the peaks [15,16].
The images after thresholding and morphological transformation need an algorithm to preserve the pupils of the patients and eliminate residual noises (clinical data). The algorithm applied was redesigned by transforming the component-connected labeling (CCL) algorithm into a noise filter, although the CCL algorithm is a labeling algorithm (called residual noise filter [RNF] in this paper). The principle of CCL is based on grouping the connected pixels into regions, such that adjacent pixels are assigned to the same label, and pixels in other regions have different labels. Although this operation can be conducted with a 4- or 8-connectivity, the transformed CCL algorithm, RNF, works with 8-connectivity as it can lead to a smooth boundary, which minimizes the effect from noise, of pupil regions adjacent to the eyelids or eyelashes during the labeling process. In addition, the RNF provides an option to adjust the parameters for distinguishing the pupils and filtering noise, considering that the pupil size varies depending on the person; a parameter value of 350 revolutions per minute as the filtering rate was used in the experiments to filter the blinking [17].
4. Data Extraction
After preprocessing, the data extraction algorithm determined the centers of the pupils from the processed images, and the centers are used as the input data of the PCA algorithm. The algorithm was designed by adding a statistics function to the CCL algorithm and can show a statistical output of the objects, such as the center, area, width, and height. Typically, image processing uses the image coordinate system in which the origin is the left-top, x increases when it is toward the right, and y increases when at the bottom. However, in a rectangular coordinate system, the origin of which is the left-bottom, x increases when it is toward the right, and y increases when it is toward the top; therefore, this system is used in the present study considering that the extracted centers will be utilized in various ways. The extracted centers are represented on the windows for observing the distributions and PCA results and are saved in the comma-separated values (CSV) format after the PCA stage using (x, y) coordinates.
When the images for analysis contain significant noise, the images immediately following preprocessing can be different from the original, which may interfere with objective judgment for a diagnosis. For instance, in an emergency that requires careful monitoring, it is more important to preserve the pupil shape during an inspection because if the shape of the pupils is damaged by the preprocessing algorithms, the distorted eye shape will interfere the decision-making during diagnosis. To improve this, the data extraction algorithm was designed to replace the pupil with a white circle (diameter of 30 pixels). The restored pupils are displayed in the form of binary images with crosshairs, and thus the clinicians can clearly observe the direction of the patient’s pupils. However, occasionally, it is necessary to confirm whether the developed analysis algorithm tracks the centers of the pupils properly. Therefore, the developed analysis algorithm offers a separate monitoring option to clinicians, through which the extracted nystagmus data are presented as green dots in the original images.
5. Expression of Processed Data
1) Target domain
Nystagmus, which is a crucial clue for diagnosing the vestibular disease, can be divided into various types of data depending on the direction and velocity, although this study is focused on classifying nystagmus based only on the velocity. Considering that the amplitude of nystagmus is approximately 4°, the corresponding pixel is approximately 15 to 20 pixels; the developed analysis algorithm based on these values classifies the nystagmus into fast and slow phases, which becomes the core information for the user to make a diagnosis.
Companies producing VNG provide nystagmus data to users by graphing the relative eye movements. However, an interpretation of the graph is also needed to obtain the nystagmus data consisting of fast and slow phases. This study suggests a novel approach, called the “target domain,” which can induce users to a quick and accurate diagnose by omitting data interpretation and providing intuitive information. All the pupil centers obtained from the patients are shown in the target domain, using red or green dots (Fig. 2D).
During the experiments, we found that it is difficult to effectively observe eye travel in a window if the nystagmus data are displayed on the target domain without additional processing, and this procedure, called “calibration,” allows the pupil coordinates to be obtained from the first frame, which is regarded as the origin of the target domain.
2) Principal component analysis
Subsequent to the data extraction stage, the acquired nystagmus data are represented in the form of a scatter plot, and such data require a special analysis method for offering meaningful data to users; hence, the PCA was selected in this study owing to its ability to provide intuitive information for the tendency of a data cluster, which is suitable for analyzing patterns (Fig. 2C).
The standard PCA is defined as a methodology for extracting features and identifying patterns in the given data. This method is modified and used in various fields, such as genetics, medical image processing, and mechanical engineering [18-21]. It consists of five steps, i.e., obtaining a dataset for analysis, making the adjusted dataset by subtracting the mean, calculating the covariance matrix including features belonging to each sample, calculating the eigenvectors and eigenvalues of the covariance matrix, selecting components and forming a feature vector, and deriving the new dataset. The results of the PCA are displayed as white and yellow arrows, which indicate horizontal and vertical components, respectively, with nystagmus data. For example, if the PCA algorithm is applied to a patient with LSCC-BPPV in the left ear, the vectors to express horizontal components of left-beats are largely displayed in a single frame; the other vectors are relatively shorter than the vectors for the horizontal components. In some cases, the displayed vectors may exceed the screen size. This predicted problem was resolved by adjusting the parameters for drawing vectors, among which the parameter for rescaling is 0.1.
The standard PCA finds the principal components by calculating the eigenvectors and eigenvalues from the given data. However, this analysis is not always effective in the analysis of nystagmus data due to the voluntary eye movements of a patient occurring during an inspection even when the video clip is recorded in the dark. Therefore, this problem was addressed by modifying the standard PCA to find the multiple contours of the objects. For this reason, the modified PCA separates the area of analysis for all nystagmus data according to connectivity, and multiple data clusters can be simultaneously analyzed in a single frame [22-25]. We calculated the ratio of scalar as the ratio of horizontal to vertical components (H to V ratio) for the relative comparision among the individuals.
3) Statistical analysis
Statistical analyses were performed using IBM SPSS Statistics ver. 26.0 (IBM Corp., Armonk, NY, USA). We used Mann-Whitney test of variations between scalars and angles of LSCC- and PSCC-BPPV to interpret Table 1 through a statistical analysis. A p-value of less than 0.05 was considered statistically significant.
RESULTS
1. Image Processing of Videonystagmography
In this study, image processing was composed of thresholding, morphology operation, RNF, and a data extraction algorithm.
The first stage applied to all experiment is thresholding. This stage induces global denoising by weakening all information of the given images according to specific values. Subsequently, in the phantom experiments, all noises except shadow noises, which are caused by the light source, were eliminated (Fig. 3B); however, in the experiments conducted using clinical data, small noises were still observed (Fig. 3G).
Particularly, because the eyelashes of a woman wearing cosmetics can be recognized as a single object connected with the pupil area after global denoising through thresholding, an additional image processing step was required. Therefore, a morphology operation was employed, which is effective in minimizing noises irregularly existing in images and intensifying the boundary separating the objects individually. However, a morphology operation was not employed in the phantom models due to sufficient thresholding in separating the pupils and noises from the models.
The developed analysis algorithm provides binary images to grasp the tendency of eye travel, while users observe the patient pupils in real-time. However, the images succeeding a morphology operation still contain noises, making it difficult to closely observe the nystagmus. The designed RNF completely eliminates residual noises in the images and applies special definitions for noise removal. As a result, all noises except the pupils were eliminated in the images, and the results were displayed in the form of a binary image (Fig. 3C, J).
The final goal of the image processing is to obtain nystagmus data as input in the PCA algorithm, from images without noises. To achieve this, the data extraction algorithm tracks the center of the pupils from the images processed by the RNF in real-time. The centers are represented as green dots in real-time with the original images on the window for monitoring (Fig. 3E, K), simultaneously displaying on the target domains with centers classified as fast (red dots) and slow (green dots) phases, thereby saving in CSV format in the same directory as the console application program, which integrates all algorithms developed from this study.
2. Distribution and Shape of Nystagmus Data
The three phantom models used in this study describe geotropic left-beats (fast phase) of the LSCC-BPPV, of which the models have 12, 24, and 36, respectively (Fig. 4). The developed analysis algorithm accurately classifies the nystagmus data and displays the target domain, which leads us to confirm that the shape of the distribution is flat without vertical components (Fig. 5), and the typical pattern of LSCC-BPPV was determined, in which the data cluster of the fast phases was located on the right side of the origin. In clinical data, however, the developed analysis algorithm cannot classify the nystagmus data accurately because of various noises including voluntary movements of the eyes, shaking of the recording equipment, and cosmetics. However, the distributions of LSCC- and PSCC-BPPV differ in terms of shape; LSCC-BPPV is flat, and PSCC-BPPV is oval. The distribution of the normal case, which is displayed in the target domain for comparison with the other cases, had a small round shape.
3. Difference in Principal Component Analysis in Nystagmus Data of Lateral Semicircular Canal and Posterior Semicircular Canal-Benign Peripheral Positional Vertigo
The PCA technique was effectively used in finding the patterns of nystagmus data in all experiments conducted in this study. The results of the PCA were presented as dominant vectors, which were selected from the eigenvectors and eigenvalues yielded by the PCA algorithm, on a single frame containing the nystagmus data of both eyes, using white and yellow colors. In the PCA stage, multiple results could be confirmed on a single frame owing to the various data clusters generated by the eye movements of a patient (Fig. 5). In this case, referring to the most primary result among the PCA results can help clinicians decide the diagnosis of BPPV.
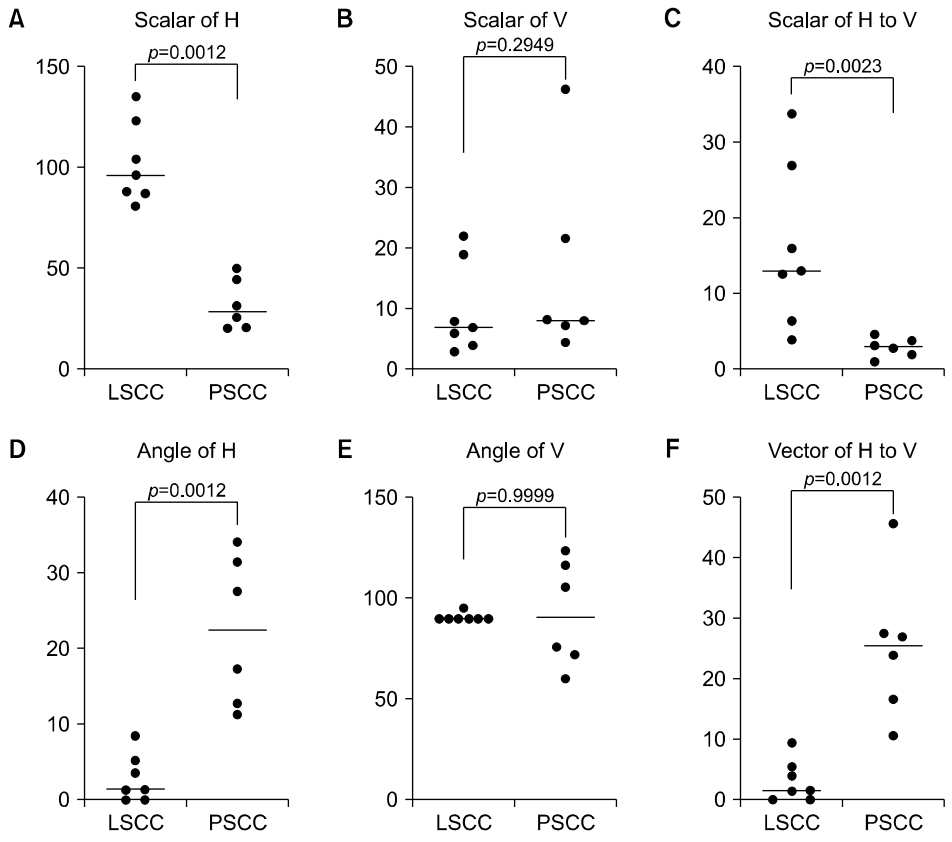
All content analyzed using the developed analysis algorithm are presented in Table 1, which comprises the diagnosis, distribution, horizontal component, vertical component, and H to V ratio of 13 patients (LSCC or PSCC) (Fig. 6). The scalar values in the horizontal component of the main vector by the PCA between LSCC- and PSCC-BPPV were significantly different (102.08±20.11 mm vs. 32.36±12.52 mm, respectively; p=0.0012). The angles of the horizontal component between LSCC- and PSCC-BPPV were was also discriminated (2.86°±3.15° vs. 22.40°± 9.86°, respectively; p=0.0012). Meanwhile, the scalar (mm) and angle (°) of the vertical component between the LSCC- and PSCC-BPPV showed no significant differences. However, there were significant differences in the H to V ratio of scalar between LSCC- and PSCC-BPPV (16.11±10.74 mm vs. 2.61±1.07 mm, respectively; p=0.0023).
DISCUSSION
Frenzel glasses have traditionally been used for observing the eye movement while magnifying the eyes of the patient. This equipment secures the visibility of the eyes and suppresses visual fixation, although misdiagnosis is still possible in the case of low-quality magnification [26]. Hence, various methodologies for addressing these shortcomings were introduced, including electro-oculography (EOG), electro-nystagmography (ENG), a scleral search coil system, video-oculography (VOG), and VNG; these techniques facilitate repeated observation and analysis through recording of all the processes of inspection. EOG or ENG are methods commonly used for recording eye movements based on the principle that eye movements cause a potential variation between the cornea and the ocular fundus as measured using electrodes collecting signals from the muscles around the eyes, thereby enabling effective observation of the eye travel of the patients. However, the methods have limitations in reflecting the position of the eyes on a graph as is and distinguishing the torsional movements of the nystagmus because they obtain signals on the skin by using electrodes instead of directly measuring the signals of the extraocular muscles, and the superposition of signals occurs during the process of collecting electrical signals. In addition, because this is a procedure that uses electrical characteristics, it might be affected by the status of the electrode attachment, causing a change in moisture or movement during inspection. Due to these disadvantages, the calibration for a correct inspection is frequently needed in clinical practice. However, the VOG and VNG, which are defined as a computerized system that records the process of all inspections through the goggles using an NIR-CCD camera, are effective considering that electrical characteristics do not need to be examined, and such equipment can record the torsional movements, unlike the other methods. Thus, the VOG or VNG have been considered to replace EOG and ENG and are the most frequently used methods in clinics [4,27]. However, an analysis technique for diagnosing the types of BPPV is additionally needed because the acquired nystagmus data are still given in a graph form.
Various studies have been conducted to develop algorithms for differential diagnosis of BPPV. Recently, an algorithm based on statistics was developed for classifying patients with substantial vertigo [28]. For validation, a clinical experiment was conducted. According to research conducted by Britt et al. [29], the sensitivity and specificity of the algorithm were 0.75 and 1.00 (95% confidence interval) for predicting the diagnosis of BPPV. The study also used physician records instead of patient questionnaires, and the results were calculated based on formulas for a linear predictor and probability of BPPV. Further, the nystagmus was analyzed using artificial intelligence in 2018. The trained model mentioned in the study consisted of a convolutional neural network, which is a core architecture in the deep-learning field, and a dataset extracted from 1,005 patients was used for algorithm validation. The average sensitivity and specificity of the learned model were 0.808±0.009 and 0.971±0.002, respectively; whereas in the PSCC and anterior semicircular canal (ASCC) categories, the sensitivity and specificity were 0.560±0.013 (PSCC-right), 0.882±0.005 (PSCC-left), 0.614±0.015 (ASCC-right), and 0.663±0.014 (ASCC-left), respectively. When the sensitivities of ASCC and PSCC were compared with those of the other cases, differences of 0.39 to 0.44 were shown. This indicates that the algorithm had a large deviation in certain cases, and that it was not easy to completely distinguish a vertical nystagmus from a horizontal nystagmus despite using artificial intelligence [5]. This is because the amplitude of the vertical nystagmus is extremely small when compared with that of the horizontal nystagmus, and thus detecting the torsional movement is generally difficult and has been considered a main issue in nystagmus differentiation. Research dealing with the development of a torsional eye movement calculation algorithm for a low contrast image was also conducted. The algorithm described in this study includes three stages for deriving results. The first stage is extracting the region of interest. The second stage is upscaling the input image and filtering through a bandpass filter. Further, the third stage is measuring the changes in angle from images that have torsional movements.
We suggest the various algorithms for analyzing the nystagmus, which can be integrated into a console application program. For an effective analysis, options allowing users to adjust the parameters, including the magnification, pupil size, and processing speed, are provided. The developed analysis algorithm is a novel approach for nystagmus pattern analysis and comprises four stages, i.e., image processing, data analysis using a PCA, display of the analyzed data, and backup of the raw data. Moreover, this developed program has four advantages. Any video clips can be converted to analysis data by tracking the center of the eye automatically. The data on the nystagmus can be classified into fast (red dots) and slow (green dots) components. The white clear circle, which simulated an imaginary pupil without any background noises, can be visualized using the results of the PCA for clinicians to observe the nystagmus well, thereby supporting the clinicians in determining the types of BPPV [30].
Because the nystagmus consists of fast and slow phases, each component of the nystagmus was presented as red or green dots on the target domain. However, the information is not always valid in a clinical setting because the developed analysis algorithm classifies fast and slow phases in the target domain, using a fixed criterion. Accordingly, if users want to employ this information in a diagnosis, they should observe the information in terms of the density for a correct judgment. Furthermore, the information regarding the target domain can be utilized in a simple process for data screening because it provides insight into whether noises are eliminated. This analysis algorithm extracts the nystagmus data from the clinical data, and the extracted data are used as input data in the PCA algorithm. Using the PCA algorithm, the new procedure that finds final vectors representing given data cluster and consisting of horizontal and vertical components can be developed in further study. Because we have not analyzed a significant amount of data yet, and cannot give an exact values of the scalar (mm) and angle (°) information for discriminating LSCC from PSCC. The rate of prevalence of PSCC and LSCC is usually higher than that of ASCC, and thus, this study is focused on PSCC and LSCC. The developed analysis algorithm can also be applied to the ASCC with the same principle. If the positional information is provided to the developed analysis algorithm, cupulolithiasis and canalolithiasis can also be classified. In the case of vertigo caused by vestibular neuritis and the central nervous system, they can be distinguished from BPPV by adding exceptional conditions or using the key features of each case. In further research, we aim to improve our algorithm and apply a time axis and/or develop an algorithm for various disease classification. If our algorithm is refined, it can be utilized as a precise feature extractor or as a support system in the diagnosis of BPPV.
The primary goal of image processing is obtaining valid information from the given data. Therefore, the proposed image processing algorithm was designed to extract only the centers of the pupils in clinical data. In addition, the processing speed can be close to real-time, and the algorithm provides options for controlling the processing speed, which helps users precisely analyze the given data. Currently, the types of VNG equipment that various companies are producing have a large size and poor portability because they usually consist of goggles and a computer system. However, if the developed analysis algorithm is employed for an embedded system using a high-performance microcomputer, it is possible to make a small and portable screening equipment for patients with nystagmus, which can also have positive effects on various emergencies by helping with diagnosis when a specialized otologist is unavailable.
ARTICLE INFORMATION
-
No potential conflict of interest relevant to this article was reported.
Acknowledgments
This work was supported by project for Joint Demand Technology R&D of Regional SMEs funded by Korea Ministry of SMEs and Startups in 2020 (project No. S3035723) and by the Starting Growth Technological R&D Program (No. S2865847) funded by the Small and Medium Business Administration (SMBA, Korea).
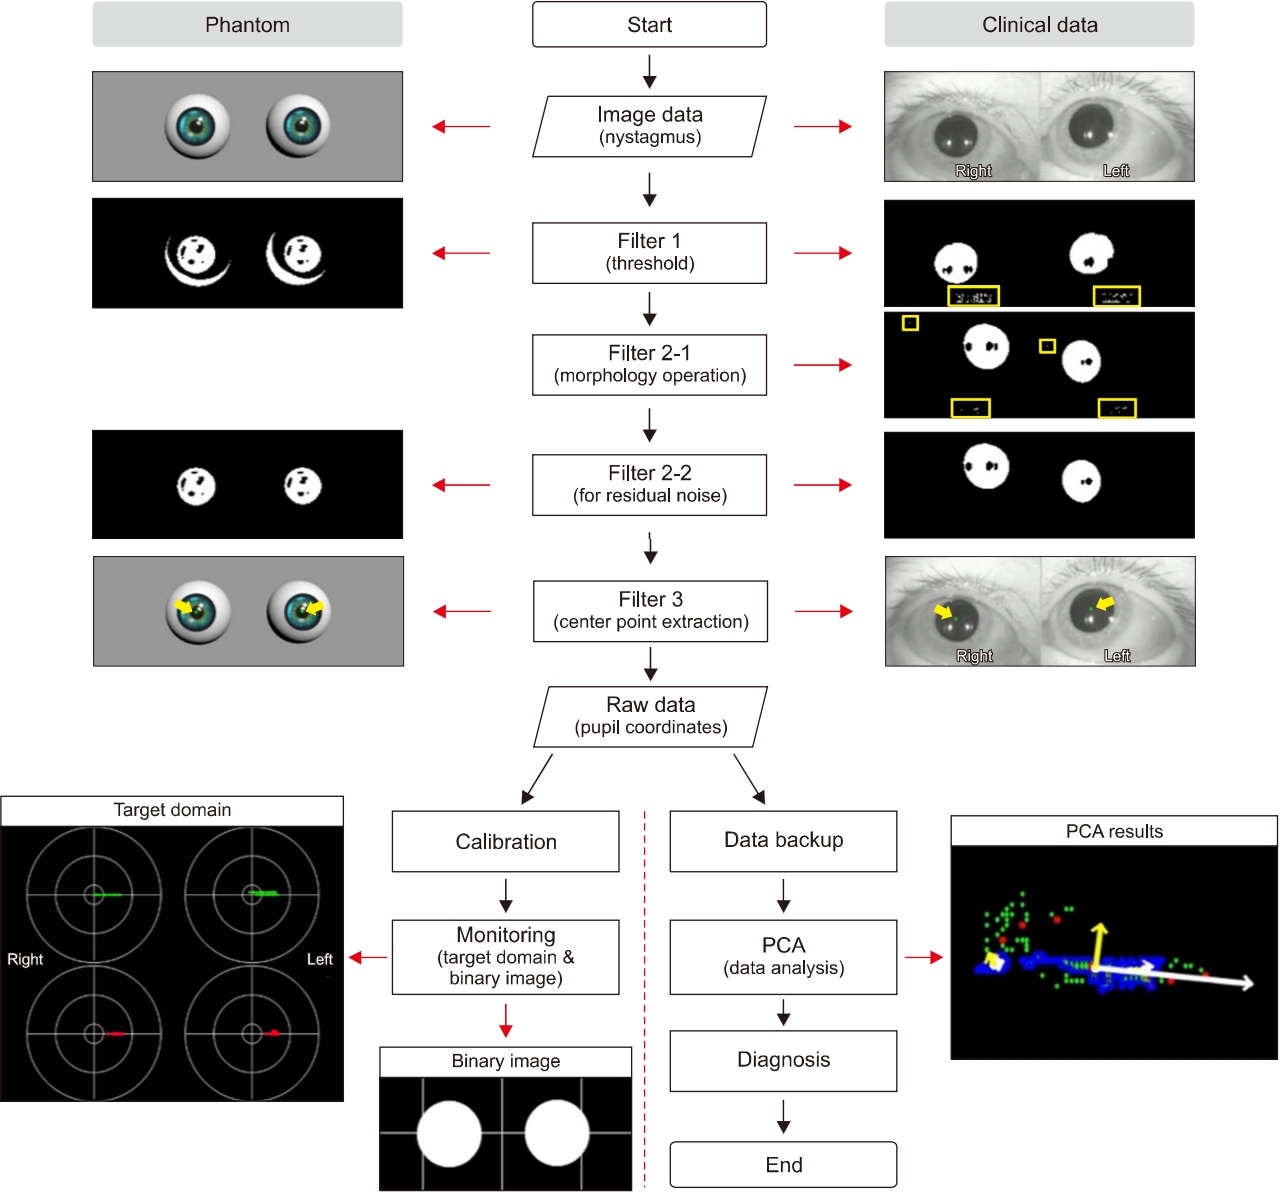
Fig. 1.Workflow of nystagmus analysis. Complete processing procedure of the developed analysis algorithm, which consists of four stages: image processing, data analysis, display of the results, and data backup. The image processing includes thresholding, a morphology operation, residual noise filtering, and data extraction. The nystagmus data obtained through the data extraction stage are presented on the target domain, and in the form of a binary image, or an original image that contains centers (green dots) for checking the tendency of the nystagmus in real-time. Concurrently, the principal component analysis (PCA) algorithm analyzes the nystagmus data, and the PCA results are displayed on a single frame together with the nystagmus data.
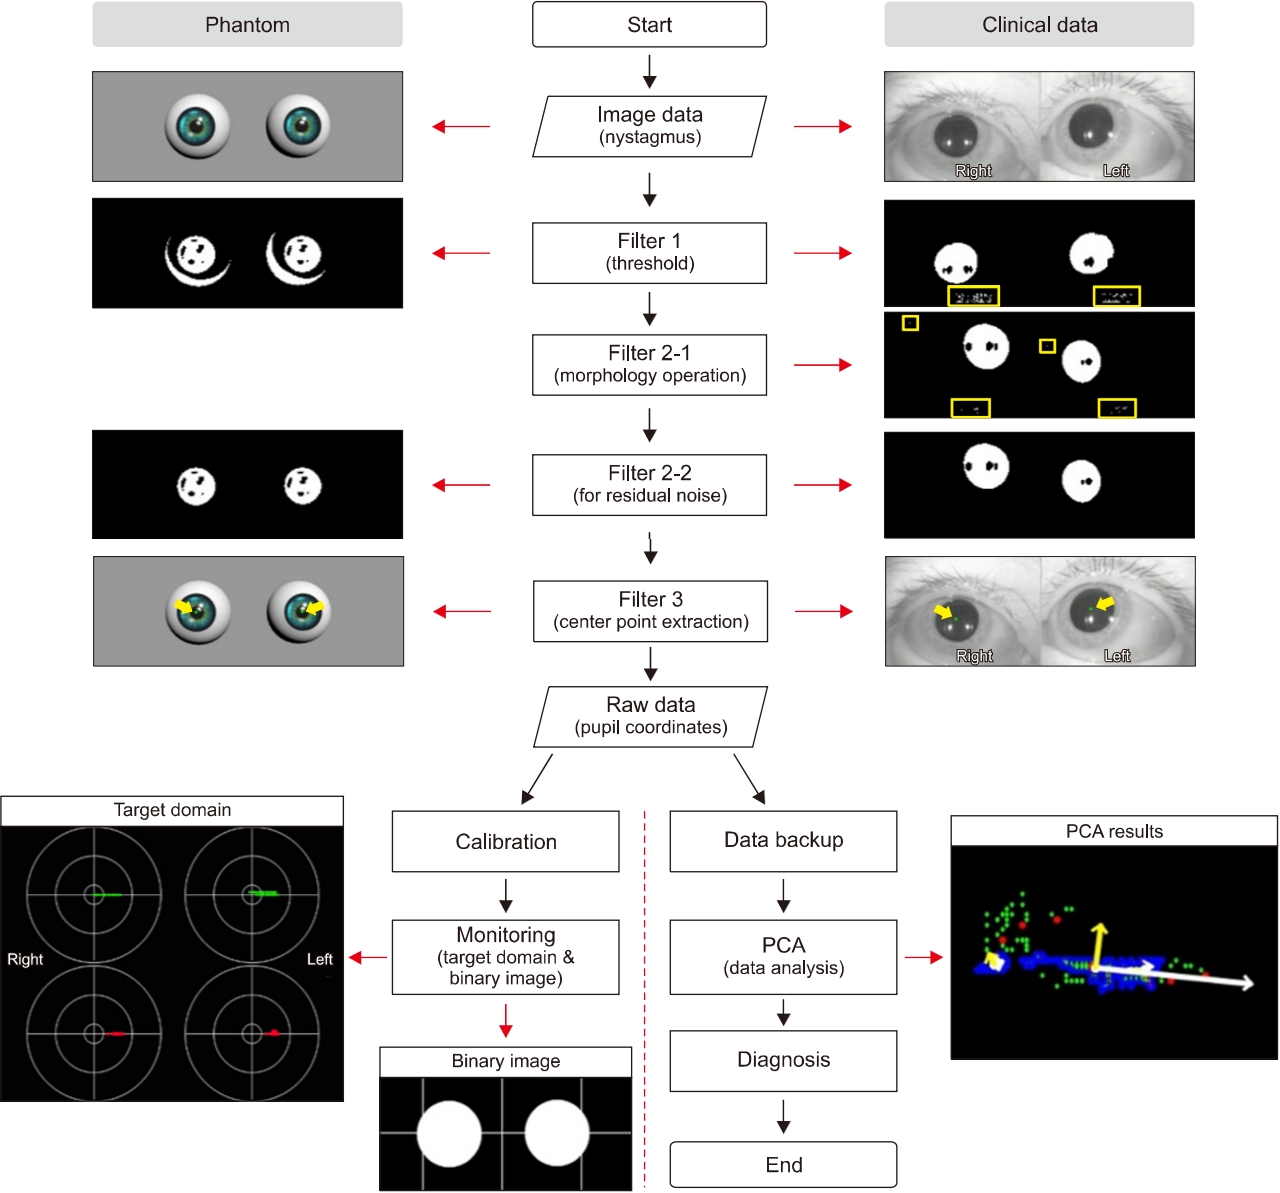
Fig. 2.Integrated analysis program. The console application integrating all the algorithms in phatom study. All processes are displayed on screens in real-time. (A) Phantom of eyes movement. (B) Binary image of eyes. (C) Results processed by the principal component analysis algorithm. (D) Target domain displaying slow and fast phases; red dots are fast phases and green dots are slow phases.
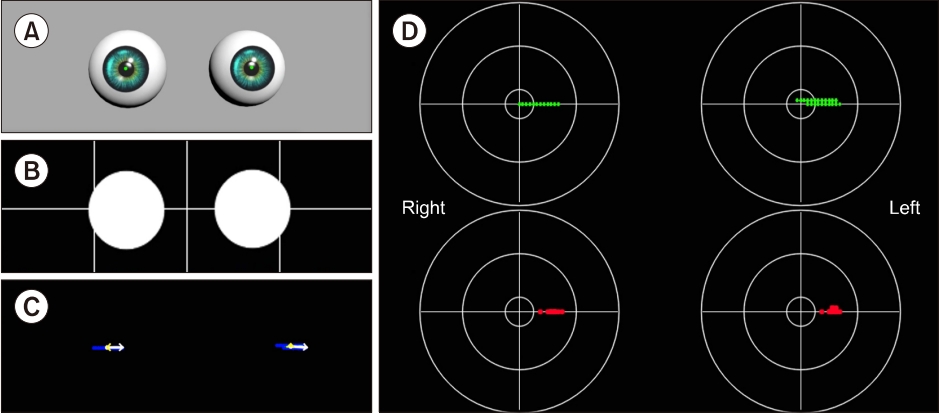
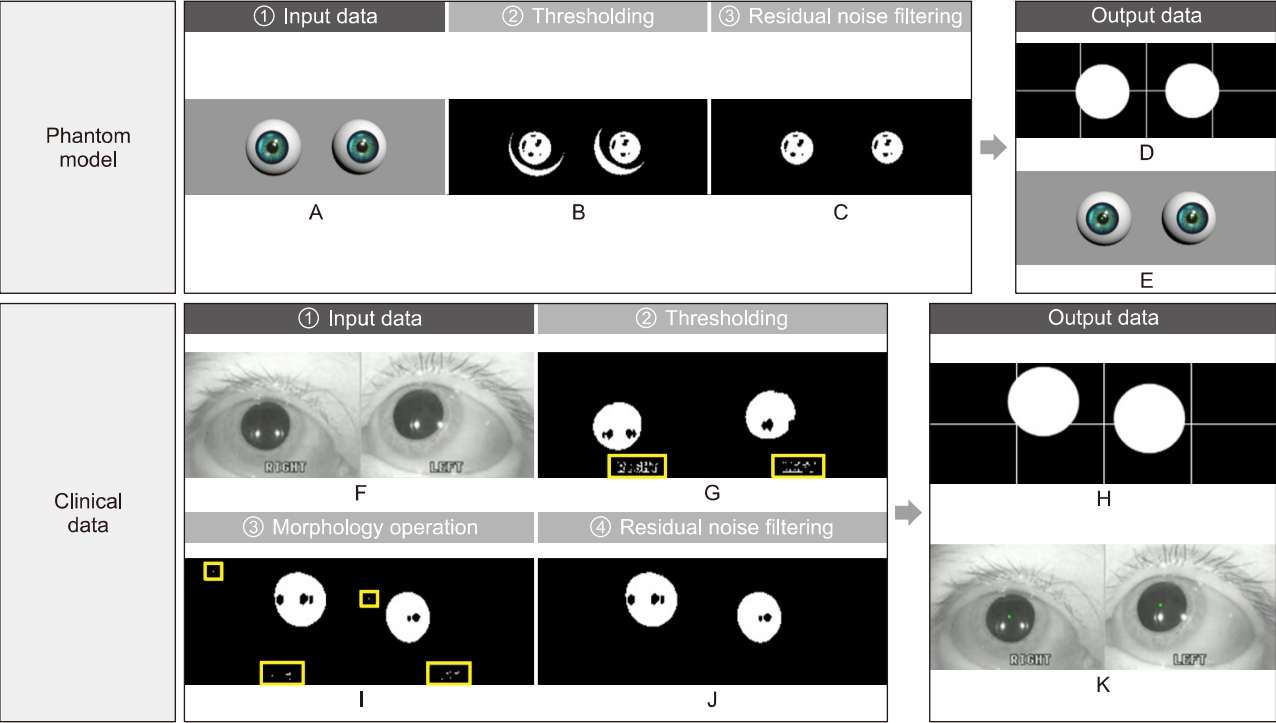
Fig. 3.Image processing. Image processing for eliminating meaningless noises and extracting nystagmus data from patient images. Input images of phantom (A) and patient (F). Preprocessing stages consist of thresholding (B, G), a morphology operation (I), and residual noise filtering (C, J). A result of data extraction is divided into the two types; for monitoring, the binary image with a cross line (D, H) and an original over-layed image with green dots (E, K).

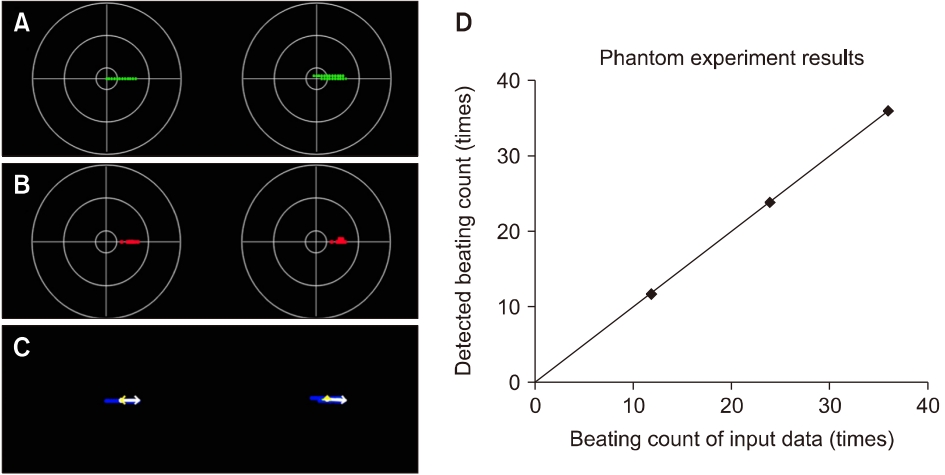
Fig. 4.Phantom experiments to verify the performance of the developed analysis algorithm. Each phantom model has 12, 24, and 36 geotropic left-beats (lateral semicircular canal canalolithiasis) and was processed using the developed analysis algorithm. The classification results of nystagmus data: (A) slow phases, (B) fast phases, and (C) result of the principal component analysis. (D) A graph describing the fast phase detection of our algorithm.
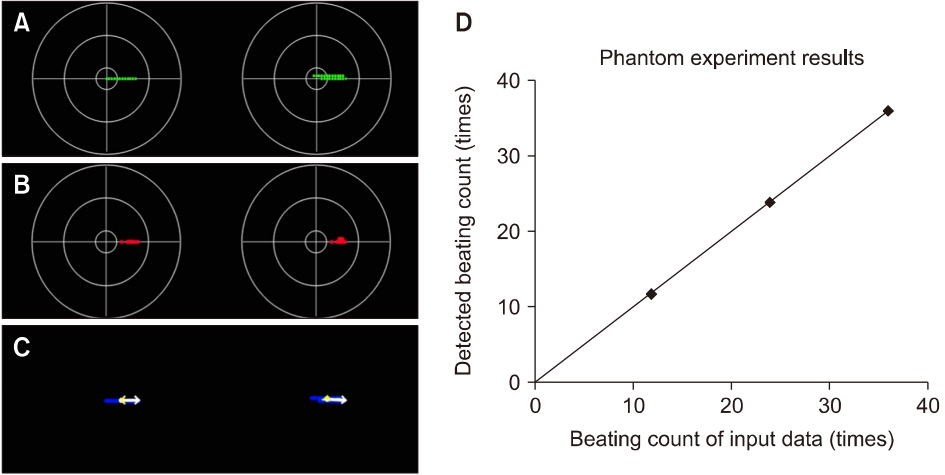
Fig. 5.Examples of clinical data analysis. Example analysis results through the principal component analysis (PCA) algorithm: each of two lateral semicircular canal (LSCC; A, D), posterior semicircular canal (PSCC; B, E), and normal (C, F) cases. The result screen can have more than two PCA results in a single frame owing to the focus movements of the patient. The horizontal components are presented as white arrows, and the vertical components as yellow. In particular, the vectors of the horizontal components are longer than those of the vertical components in the LSCC cases, whereas the vectors of the vertical components are similar to or longer than those of the horizontal components in the PSCC cases.
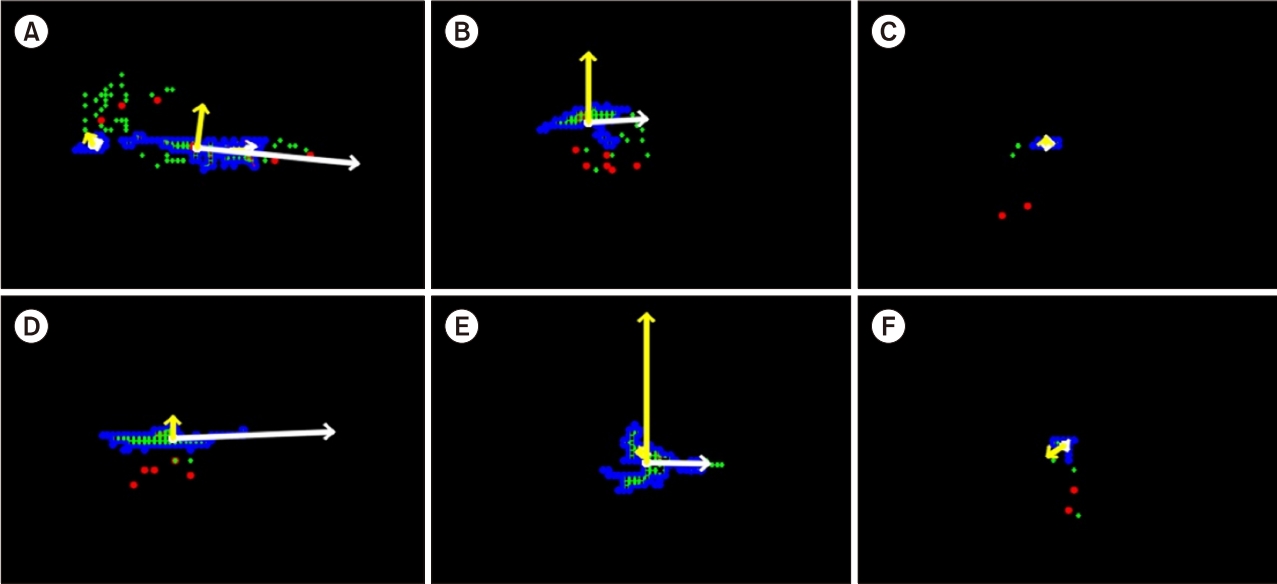
Fig. 6.Comparisons of horizontal and vertical components between LSCC- and PSCC-benign peripheral positional vertigo by principal component analysis. (A) Scalar of horizontal component (H) between LSCC and PSCC. (B) Scalar of vertical component (V). (C) Scalar of H to V. (D) Angle of H. (E) Angle of V. (F) Vector of H to V. LSCC, lateral semicircular canal; PSCC, posterior semicircular canal.

Table 1.Patient lists
|
Patient No. |
Diagnosis
|
Shape |
H of main vector
|
V of main vector
|
H to V ratioa)
|
|
Symptom |
Type |
Scalar (mm) |
Angle (°) |
Scalar (mm) |
Angle (°) |
|
1 |
L-LSCC |
Canalolithiasis |
Flat |
88.00 |
0.00 |
7.00 |
90.00 |
12.57 |
|
2 |
L-LSCC |
Canalolithiasis |
Flat |
96.19 |
–3.58 |
6.00 |
90.00 |
16.03 |
|
3 |
L-LSCC |
Canalolithiasis |
Flat |
80.90 |
8.53 |
3.00 |
90.00 |
26.97 |
|
4 |
L-LSCC |
Canalolithiasis |
Flat |
135.03 |
–1.27 |
4.00 |
90.00 |
33.76 |
|
5 |
L-LSCC |
Canalolithiasis |
Flat |
104.00 |
0.00 |
8.00 |
90.00 |
13.00 |
|
6 |
L-LSCC |
Canalolithiasis |
Flat |
123.04 |
1.40 |
19.00 |
90.00 |
6.48 |
|
7 |
L-LSCC |
Canalolithiasis |
Flat |
87.37 |
5.25 |
22.01 |
95.19 |
3.97 |
|
8 |
L-PSCC |
Canalolithiasis |
Oval |
21.10 |
31.43 |
4.47 |
116.60 |
4.72 |
|
9 |
L-PSCC |
Canalolithiasis |
Oval |
50.29 |
–17.35 |
46.17 |
72.35 |
1.09 |
|
10 |
L-PSCC |
Canalolithiasis |
Oval |
31.78 |
–12.72 |
8.25 |
75.97 |
3.85 |
|
11 |
L-PSCC |
Canalolithiasis |
Oval |
44.65 |
34.06 |
21.63 |
123.69 |
2.06 |
|
12 |
L-PSCC |
Canalolithiasis |
Oval |
20.40 |
11.31 |
7.28 |
105.95 |
2.80 |
|
13 |
L-PSCC |
Canalolithiasis |
Oval |
25.94 |
–27.55 |
8.06 |
60.26 |
3.22 |
|
14 |
Normal |
NA |
Round |
5.00 |
–53.13 |
3.00 |
–146.31 |
1.67 |
|
15 |
Normal |
NA |
Round |
7.00 |
0.00 |
1.00 |
90.00 |
7.00 |
REFERENCES
- 1. Barber HO, Stockwell CW. Manual of electronystagmography. St. Louis: C.V. Mosby; 1980.
- 2. Bhattacharyya N, Gubbels SP, Schw artz SR, Edlow JA, ElKashlan H, Fife T, et al. Clinical practice guideline: benign paroxysmal positional vertigo (update) executive summary. Otolaryngol Head Neck Surg 2017;156:403–16.ArticlePubMed
- 3. Schmal F, Stoll W. Diagnosis and management of benign paroxysmal positional vertigo. Laryngorhinootologie 2002;81:368–80.PubMed
- 4. Ganança MM, Caovilla HH, Ganança FF. Electronystagmography versus videonystagmography. Braz J Otorhinolaryngol 2010;76:399–403.PubMed
- 5. Lim EC, Park JH, Jeon HJ, Kim HJ, Lee HJ, Song CG, et al. Developing a diagnostic decision support system for benign paroxysmal positional vertigo using a deep-learning model. J Clin Med 2019;8:633. ArticlePubMedPMC
- 6. Ben Slama A, Mouelhi A, Sahli H, Manoubi S, Mbarek C, Trabelsi H, et al. A new preprocessing parameter estimation based on geodesic active contour model for automatic vestibular neuritis diagnosis. Artif Intell Med 2017;80:48–62.ArticlePubMed
- 7. Sahoo PK, Soltani S, Wong AK. A survey of thresholding techniques. Comput Vis Graph Image Process 1988;41:233–60.Article
- 8. Singh TR, Roy S, Singh OI, Sinam T, Singh K. A new local adaptive thresholding technique in binarization arXiv 1201.5227 [Preprint]. 2012 arXiv [posted 2012 Jan 25]. Available from: https://arxiv.org/abs/1201.5227.
- 9. Cheriet M, Said JN, Suen CY. A recursive thresholding technique for image segmentation. IEEE Trans Image Process 1998;7:918–21.ArticlePubMed
- 10. Moghaddam RF, Cheriet M. AdOtsu: An adaptive and parameterless generalization of Otsu's method for document image binarization. Pattern Recognit 2012;45:2419–31.Article
- 11. Gatos B, Pratikakis I, Perantonis SJ. Adaptive degraded document image binarization. Pattern Recognit 2006;39:317–27.Article
- 12. Ntirogiannis K, Gatos B, Pratikakis I. Performance evaluation methodology for historical document image binarization. IEEE Trans Image Process 2013;22:595–609.ArticlePubMed
- 13. Valizadeh M, Kabir E. Binarization of degraded document image based on feature space partitioning and classification. Int J Doc Anal Recogn 2012;15:57–69.Article
- 14. Otsu N. A threshold selection method from gray-level histograms. IEEE Trans Syst Man Cybern Syst 1979;9:62–6.Article
- 15. Haralick RM, Sternberg SR, Zhuang X. Image analysis using mathematical morphology. IEEE Trans Pattern Anal Mach Intell 1987;9:532–50.ArticlePubMed
- 16. Heijmans HJ, Ronse C. The algebraic basis of mathematical morphology I. Dilations and erosions. Comput Vis Graph Image Process 1990;50:245–95.Article
- 17. Shapiro LG. Connected component labeling and adjacency graph construction. Mach Intell Patt Recognit 1996;19:1–30.Article
- 18. Reich D, Price AL, Patterson N. Principal component analysis of genetic data. Nat Genet 2008;40:491–2.ArticlePubMed
- 19. Li C, Joiner J, Krotkov NA, Bhartia PK. A fast and sensitive new satellite SO2 retrieval algorithm based on principal component analysis: application to the ozone monitoring instrument. Geophys Res Lett 2013;40:6314–8.Article
- 20. Zhang Y, Liu J, Li M, Guo Z. Joint image denoising using adaptive principal component analysis and self-similarity. Inf Sci 2014;259:128–41.Article
- 21. Duforet-Frebourg N, Luu K, Laval G, Bazin E, Blum MG. Detecting genomic signatures of natural selection with principal component analysis: application to the 1000 genomes data. Mol Biol Evol 2016;33:1082–93.ArticlePubMed
- 22. Wold S, Esbensen K, Geladi P. Principal component analysis. Chemom Intell Lab Syst 1987;2:37–52.Article
- 23. Smith LI. A tutorial on principal components analysis (computer science technical report No. OUCS-2002-12) [Internet]. Dunedin, Department of Computer Science, University of Otago. 2002;[cited 2021 Oct 11]. Available from: http://hdl.handle.net/10523/7534.
- 24. Holland SM. Principal component analysis (PCA). Athens, GA: Department of Geology, University of Georgia; 2008.
- 25. A bdi H, Williams LJ. Principal component analysis. WIREs Comp Stats 2010;2:433–59.Article
- 26. Ben-David Y, Hafner H, Fradis M, Krasnitz G, Podoshin L. Do Frenzel glasses have a place in the modern electronystagmography laboratory? Am J Otol 1996;17:89–92.PubMed
- 27. Bhansali SA, Honrubia V. Current status of electronystagmography testing. Otolaryngol Head Neck Surg 1999;120:419–26.ArticlePubMed
- 28. Friedland D R, Tarima S, Erbe C, Miles A. Development of a statistical model for the prediction of common vestibular diagnoses. JAMA Otolaryngol Head Neck Surg 2016;142:351–6.ArticlePubMedPMC
- 29. Britt CJ, Ward BK, Owusu Y, Friedland D, Russell JO, Weinreich HM. Assessment of a statistical algorithm for the prediction of benign paroxysmal positional vertigo. JAMA Otolaryngol Head Neck Surg 2018;144:883–6.ArticlePubMedPMC
- 30. Seo YJ, Park YA, Kong TH, Bae MR, Kim SH. Head position and increased head velocity to optimize video head impulse test sensitivity. Eur Arch Otorhinolaryngol 2016;273:3595–602.ArticlePubMed
Citations
Citations to this article as recorded by

- Development of An Algorithm for Slippage-Induced Motion Artifacts Reduction in Video-Nystagmography
Yerin Lee, Young Joon Seo, Sejung Yang
Research in Vestibular Science.2022; 21(4): 104. CrossRef

 , 양세정3, 서영준1,2
 PubReader
 ePub Link
 Cite
Cite